
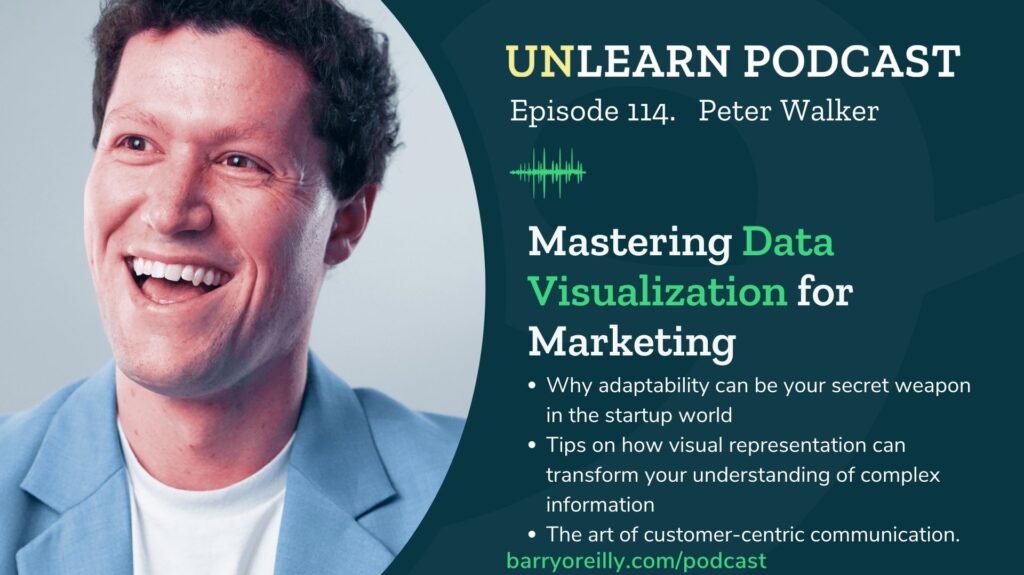
Peter Walker is a data-driven content marketer known for his expertise in using data and analytics to create insightful and engaging content. In his role as Head of Insights at Carta, Peter’s work often revolves around visualizing data in a way that makes it accessible to a broad audience, helping people understand complex topics and trends. He has contributed significantly to the field of data-driven content marketing and is known for his ability to provide valuable insights through his work. In this episode of the Unlearn Podcast, Peter joins Barry O’Reilly to discuss the use of data and analytics in content marketing. He shares insights into his experiences in transitioning from a data analyst to a data-driven content marketer and offers valuable advice for those looking to embark on a similar journey in data-driven marketing.
The Data’s in the Details
When building a business, you may come across instances where you feel like you’ve hit a wall – especially in the budding stages, when you’re doing the job of three people. “There’s always the chance that you’re going to hit it big, but in practice I think the responsibility and adaptability that you need to survive in a startup is [often] more important than the equity you receive,” Peter says. Being adaptable and open to exploring new skills takes you far. For example, Peter’s career shift from data analyst to product marketer helped him discover his passion for data visualization and design. This shift allowed him to bridge the gap between data and communication effectively. [Listen from 2:20]
Subscribe


Carta’s Magna Carta
There are two main approaches to data analysis at Carta, Peter explains. The first approach is to create reports that answer clear questions by presenting data in a clear and concise manner. The goal of this approach is to provide readers with a straightforward understanding of key metrics, such as valuations and funding rounds. This approach is not about creating flashy graphics, but rather about delivering clarity and answers to specific questions. The second, more interesting approach is the discovery and exploration phase. Peter mentions the value of tools like Tableau, which allow him to dive into data without a predetermined goal. He often starts with scatter plots to understand data distributions, and then applies filters to investigate various dimensions such as time, stage, or industry. The key is to find the most compelling and distinct visual representation of the data. [Listen from 9:15]
Barry shares his experience attending Edward Tufte’s seminar on data visualization. He mentions that Tufte’s approach is less about prescribing specific visualization types and more about showing the context and significance behind each visualization. “People love to jump in and cause debate [on the internet],” Barry says, but the ultimate goal is to capture attention and provide valuable information. [Listen from 13:00]
(Listen to Launching Ideas at Lightning Speed with Adam Bragg)
No “Right” Way
“As a data analyst just coming out of school, your world is numbers and you by default assume that everyone can follow the same story that you’re seeing in the spreadsheet and it’s just not the case,” Peter shares. As he transitioned into product marketing, he recognized that presenting complex data to customers required simplifying it and speaking their language. This shift in mindset from data-centric to customer-centric communication was crucial to his professional development. He highlights the importance of having a deep understanding of data and context, which enables individuals to filter out irrelevant information and focus on key takeaways. It’s not necessary for data to be perfectly polished; what matters is the ability to extract valuable insights from it. Data can be overwhelming and difficult to interpret, especially if it is not well-organized, so having a clear understanding of the data before attempting to analyze it is imperative. This includes understanding the data’s origins, its limitations, and the potential biases that may be present. [Listen from 15:40]
Barry and Peter further discuss the challenges of determining fair compensation for startup advisors, a topic rife with ambiguity. “A lot of startups in the US and elsewhere will compensate advisors with company equity, actual ownership as opposed to cash because they don’t have any cash… And so that opens up this Pandora’s box of questions about how much equity an advisor should receive,” Peter says. He explains how Carta’s data visualization, particularly a graphic showing the median advisor equity grants for different stages of startups, serves as a helpful tool. The graphic provides a range of advisor equity percentages, enabling founders and advisors to have more informed and fact-based discussions about compensation. [Listen from 18:15]
What’s Data Got to Do with It?
Barry emphasizes the value of transparency in presenting data, highlighting a graphic created by Peter that displays advisor equity ranges, based on a substantial dataset of 20,301 US grants. Barry commends the graphic for instilling credibility and subtly asserting its authority due to the substantial volume of data it represents. Such visuals facilitate healthy debates and discussions among audiences. Peter provides insights on how to get started in the field of data-driven marketing and insights. He encourages marketers not to be intimidated by business intelligence tools or data analysis, stating, “Don’t be scared off by the idea that business intelligence tools or graphics or even SQL is that hard.” “That’s a limiting belief,” Barry confirms. Peter suggests that there are user-friendly tools and programs available, making it more accessible than ever to work with data and create impactful visuals. [Listen from 24:05]
Looking Ahead
Peter’s primary piece of advice is to start by collecting questions from the audience. By listening to what their target audience is wondering about and collecting those inquiries, aspiring data marketers can identify valuable topics to explore. He emphasizes the importance of addressing questions that genuinely matter to the audience. [Listen from 29:45]